White-eared Honeyeater
Nesoptilotis leucotis
ABR description
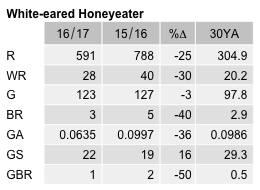
The following is extracted from the Annual Bird Report for the twelve months to June 2017.
Common, breeding resident/altitudinal migrant
Generally uncommon in the suburbs.
General: The number of records (602) was lower than last year. Reporting rate of 4.3% was 37% lower than last year (6.8%) and significantly below the 11.2% 30YA. Records highest in autumn and winter (36% each). Max 12/30 Oct Hall GrJ10 (McD4), mean 2, median 1. 3 breeding records: dy/8 Jan NNP Warks/Blundell Ck Rds GrE15 (ReS1), dy/23 Jan Cuumbeun NR GrO15 (BuM1) and ny/26 Jan Carwoola GrQ16 (BuM1).
GBS: Recorded at 37% sites, higher than last year. 35% of records in autumn, 24% in winter and 27% in spring, double the usual percentage. More than half of all records were from 3 rural sites in Wamboin GrQ12, Carwoola Gr Q16 and Burra GrM20, with records virtually absent (as usual) from suburban sites between Sep and March. The A-value (0.0635) was one-third lower than last year and the 30YA.
Abundance
Abundance is the average number of birds of that species per survey. Where the species was observed (presence recorded) but the number of birds seen was not recorded, this is treated as a count of zero.
Abundance by year
This chart shows the abundance of White-eared Honeyeater between 1982 and 2017. 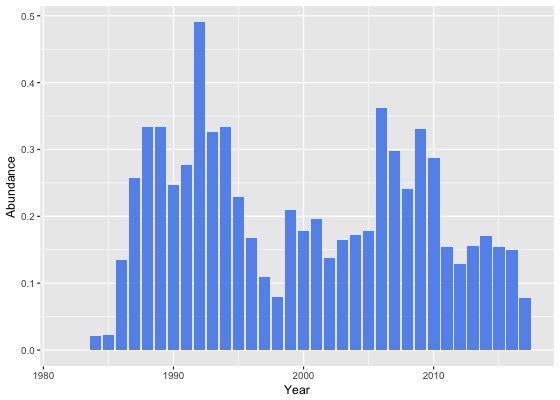
Abundance by month
This chart shows the monthly abundance of White-eared Honeyeater. The blue lines show the abundance for the twelve months to June 2017 and the bars show the average abundance for the period 1982 to 2017. 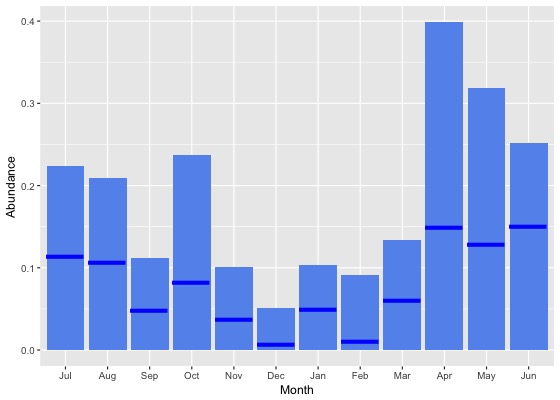
Abundance by season
This chart shows the seasonal abundance of White-eared Honeyeater. The blue lines show the seasonal abundance for the twelve months to June 2017 and the bars show the average seasonal abundance for the period 1982 to 2017. 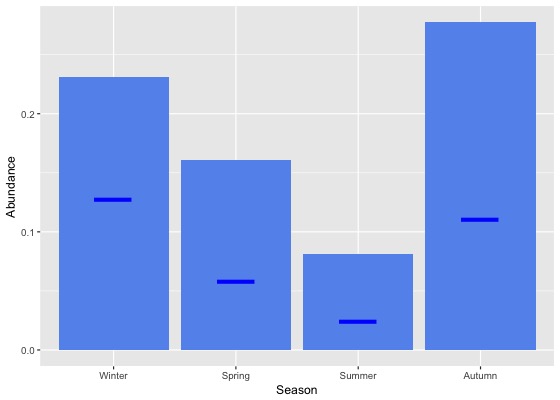
Abundance data
| Month | Season | ||||||||||||||||||
|---|---|---|---|---|---|---|---|---|---|---|---|---|---|---|---|---|---|---|---|
| Period | Jul | Aug | Sep | Oct | Nov | Dec | Jan | Feb | Mar | Apr | May | Jun | Winter | Spring | Summer | Autumn | All | ||
| All years | |||||||||||||||||||
| All | 0.2 | 0.2 | 0.1 | 0.2 | 0.1 | 0.1 | 0.1 | 0.1 | 0.1 | 0.4 | 0.3 | 0.3 | 0.2 | 0.2 | 0.1 | 0.3 | 0.2 | ||
| Previous years | |||||||||||||||||||
| All previous years | 0.2 | 0.2 | 0.1 | 0.3 | 0.1 | 0.1 | 0.1 | 0.1 | 0.1 | 0.4 | 0.4 | 0.3 | 0.2 | 0.2 | 0.1 | 0.3 | 0.2 | ||
| Previous 30 years | 0.2 | 0.2 | 0.1 | 0.3 | 0.1 | 0.1 | 0.1 | 0.1 | 0.1 | 0.4 | 0.4 | 0.3 | 0.3 | 0.2 | 0.1 | 0.3 | 0.2 | ||
| Previous 20 years | 0.2 | 0.2 | 0.1 | 0.3 | 0.1 | 0.0 | 0.1 | 0.1 | 0.1 | 0.4 | 0.3 | 0.3 | 0.2 | 0.2 | 0.1 | 0.3 | 0.2 | ||
| 10 year groups | |||||||||||||||||||
| [2007,2017) | 0.2 | 0.2 | 0.1 | 0.3 | 0.1 | 0.0 | 0.1 | 0.1 | 0.1 | 0.3 | 0.3 | 0.3 | 0.2 | 0.2 | 0.1 | 0.3 | 0.2 | ||
| [1997,2007) | 0.2 | 0.2 | 0.1 | 0.1 | 0.1 | 0.0 | 0.1 | 0.1 | 0.1 | 0.6 | 0.4 | 0.3 | 0.2 | 0.1 | 0.1 | 0.4 | 0.2 | ||
| [1987,1997) | 0.3 | 0.3 | 0.2 | 0.2 | 0.2 | 0.2 | 0.2 | 0.2 | 0.3 | 0.6 | 0.5 | 0.4 | 0.3 | 0.2 | 0.2 | 0.4 | 0.3 | ||
| 5 year groups | |||||||||||||||||||
| [2012,2017) | 0.2 | 0.2 | 0.1 | 0.2 | 0.0 | 0.0 | 0.1 | 0.1 | 0.1 | 0.3 | 0.3 | 0.2 | 0.2 | 0.1 | 0.1 | 0.2 | 0.2 | ||
| [2007,2012) | 0.3 | 0.2 | 0.1 | 0.5 | 0.1 | 0.1 | 0.2 | 0.2 | 0.2 | 0.4 | 0.4 | 0.3 | 0.3 | 0.3 | 0.1 | 0.3 | 0.3 | ||
| [2002,2007) | 0.2 | 0.2 | 0.1 | 0.2 | 0.1 | 0.0 | 0.1 | 0.1 | 0.1 | 0.8 | 0.4 | 0.3 | 0.2 | 0.1 | 0.1 | 0.4 | 0.2 | ||
| [1997,2002) | 0.2 | 0.2 | 0.1 | 0.1 | 0.1 | 0.0 | 0.1 | 0.1 | 0.1 | 0.4 | 0.5 | 0.3 | 0.2 | 0.1 | 0.1 | 0.3 | 0.2 | ||
| [1992,1997) | 0.2 | 0.3 | 0.2 | 0.3 | 0.2 | 0.1 | 0.2 | 0.2 | 0.3 | 0.8 | 0.4 | 0.2 | 0.2 | 0.2 | 0.2 | 0.5 | 0.3 | ||
| [1987,1992) | 0.4 | 0.4 | 0.2 | 0.2 | 0.2 | 0.2 | 0.2 | 0.2 | 0.3 | 0.5 | 0.5 | 0.4 | 0.4 | 0.2 | 0.2 | 0.4 | 0.3 | ||
| Year | |||||||||||||||||||
| 2017 | 0.1 | 0.1 | 0.0 | 0.1 | 0.0 | 0.0 | 0.1 | 0.0 | 0.1 | 0.1 | 0.1 | 0.2 | 0.1 | 0.1 | 0.0 | 0.1 | 0.1 | ||
| 2016 | 0.2 | 0.2 | 0.1 | 0.1 | 0.1 | 0.0 | 0.1 | 0.1 | 0.1 | 0.3 | 0.3 | 0.2 | 0.2 | 0.1 | 0.1 | 0.2 | 0.2 | ||
| 2015 | 0.2 | 0.2 | 0.1 | 0.2 | 0.0 | 0.0 | 0.1 | 0.1 | 0.1 | 0.3 | 0.3 | 0.2 | 0.2 | 0.1 | 0.1 | 0.2 | 0.2 | ||
| 2014 | 0.2 | 0.1 | 0.0 | 0.3 | 0.0 | 0.0 | 0.1 | 0.1 | 0.2 | 0.4 | 0.3 | 0.2 | 0.2 | 0.2 | 0.1 | 0.3 | 0.2 | ||
| 2013 | 0.1 | 0.2 | 0.1 | 0.3 | 0.1 | 0.0 | 0.0 | 0.1 | 0.0 | 0.3 | 0.3 | 0.3 | 0.2 | 0.2 | 0.0 | 0.2 | 0.2 | ||
| 2012 | 0.2 | 0.1 | 0.1 | 0.2 | 0.0 | 0.0 | 0.1 | 0.1 | 0.1 | 0.2 | 0.2 | 0.2 | 0.2 | 0.1 | 0.1 | 0.2 | 0.1 | ||
| 2011 | 0.4 | 0.2 | 0.1 | 0.2 | 0.2 | 0.0 | 0.1 | 0.1 | 0.0 | 0.4 | 0.1 | 0.2 | 0.2 | 0.2 | 0.0 | 0.2 | 0.2 | ||
| 2010 | 0.5 | 0.1 | 0.0 | 0.5 | 0.0 | 0.0 | 0.3 | 0.1 | 0.2 | 0.6 | 0.8 | 0.3 | 0.3 | 0.3 | 0.1 | 0.4 | 0.3 | ||
| 2009 | 0.4 | 0.2 | 0.1 | 0.7 | 0.2 | 0.1 | 0.3 | 0.2 | 0.3 | 0.3 | 0.4 | 0.2 | 0.3 | 0.4 | 0.2 | 0.4 | 0.3 | ||
| 2008 | 0.2 | 0.1 | 0.1 | 0.4 | 0.1 | 0.0 | 0.2 | 0.3 | 0.1 | 0.3 | 0.6 | 0.5 | 0.3 | 0.2 | 0.1 | 0.3 | 0.2 | ||
| 2007 | 0.2 | 0.3 | 0.2 | 0.5 | 0.0 | 0.2 | 0.2 | 0.2 | 0.2 | 0.6 | 0.6 | 0.3 | 0.3 | 0.3 | 0.2 | 0.4 | 0.3 | ||
| 2006 | 0.3 | 0.1 | 0.0 | 0.3 | 0.1 | 0.0 | 0.1 | 0.1 | 0.1 | 2.2 | 0.5 | 0.4 | 0.3 | 0.2 | 0.1 | 0.8 | 0.4 | ||
| 2005 | 0.2 | 0.3 | 0.1 | 0.1 | 0.0 | 0.1 | 0.2 | 0.4 | 0.0 | 0.3 | 0.3 | 0.3 | 0.3 | 0.1 | 0.2 | 0.2 | 0.2 | ||
| 2004 | 0.2 | 0.2 | 0.1 | 0.1 | 0.2 | 0.0 | 0.1 | 0.1 | 0.0 | 0.6 | 0.4 | 0.1 | 0.2 | 0.1 | 0.1 | 0.3 | 0.2 | ||
| 2003 | 0.2 | 0.4 | 0.1 | 0.0 | 0.0 | 0.0 | 0.1 | 0.0 | 0.2 | 0.5 | 0.3 | 0.2 | 0.3 | 0.1 | 0.0 | 0.3 | 0.2 | ||
| 2002 | 0.2 | 0.2 | 0.0 | 0.1 | 0.2 | 0.1 | 0.0 | 0.1 | 0.1 | 0.3 | 0.3 | 0.2 | 0.2 | 0.1 | 0.1 | 0.2 | 0.1 | ||
| 2001 | 0.2 | 0.2 | 0.1 | 0.2 | 0.1 | 0.1 | 0.1 | 0.1 | 0.2 | 0.5 | 0.5 | 0.3 | 0.2 | 0.1 | 0.1 | 0.3 | 0.2 | ||
| 2000 | 0.3 | 0.2 | 0.1 | 0.0 | 0.3 | 0.0 | 0.1 | 0.1 | 0.2 | 0.4 | 0.3 | 0.3 | 0.3 | 0.2 | 0.1 | 0.3 | 0.2 | ||
| 1999 | 0.2 | 0.4 | 0.2 | 0.1 | 0.1 | 0.1 | 0.1 | 0.1 | 0.1 | 0.3 | 0.6 | 0.3 | 0.3 | 0.1 | 0.1 | 0.3 | 0.2 | ||
| 1998 | 0.0 | 0.1 | 0.1 | 0.1 | 0.0 | 0.0 | 0.2 | 0.0 | 0.0 | 0.1 | 0.5 | 0.1 | 0.1 | 0.1 | 0.1 | 0.1 | 0.1 | ||
| 1997 | 0.1 | 0.0 | 0.1 | 0.0 | 0.0 | 0.1 | 0.0 | 0.0 | 0.3 | 0.4 | 0.4 | 0.1 | 0.1 | 0.0 | 0.0 | 0.4 | 0.1 | ||
| 1996 | 0.1 | 0.2 | 0.0 | 0.1 | 0.2 | 0.1 | 0.0 | 0.4 | 0.0 | 0.4 | 0.5 | 0.2 | 0.2 | 0.1 | 0.2 | 0.3 | 0.2 | ||
| 1995 | 0.2 | 0.3 | 0.1 | 0.0 | 0.4 | 0.0 | 0.0 | 0.0 | 0.3 | 0.7 | 0.4 | 0.2 | 0.2 | 0.2 | 0.0 | 0.5 | 0.2 | ||
| 1994 | 0.3 | 0.3 | 0.1 | 0.2 | 0.0 | 0.3 | 0.7 | 0.0 | 0.6 | 0.7 | 0.4 | 0.3 | 0.3 | 0.1 | 0.3 | 0.6 | 0.3 | ||
| 1993 | 0.1 | 0.6 | 0.6 | 0.3 | 0.3 | 0.0 | 0.6 | 0.0 | 0.4 | 0.2 | 0.3 | 0.2 | 0.4 | 0.4 | 0.2 | 0.3 | 0.3 | ||
| 1992 | 0.2 | 0.4 | 0.5 | 0.9 | 0.3 | 0.0 | 0.2 | 0.3 | 0.5 | 2.0 | 0.4 | 0.1 | 0.2 | 0.6 | 0.2 | 0.9 | 0.5 | ||
| 1991 | 0.2 | 0.5 | 0.1 | 0.0 | 0.5 | 0.1 | 0.2 | 0.0 | 0.1 | 0.8 | 0.3 | 0.6 | 0.4 | 0.2 | 0.1 | 0.4 | 0.3 | ||
| 1990 | 0.3 | 0.3 | 0.2 | 0.0 | 0.1 | 0.2 | 0.1 | 0.1 | 0.0 | 0.8 | 0.4 | 0.2 | 0.3 | 0.1 | 0.1 | 0.4 | 0.2 | ||
| 1989 | 0.5 | 0.4 | 0.4 | 0.3 | 0.2 | 0.3 | 0.3 | 0.2 | 0.3 | 0.4 | 0.5 | 0.4 | 0.4 | 0.3 | 0.3 | 0.4 | 0.3 | ||
| 1988 | 0.4 | 0.4 | 0.2 | 0.2 | 0.2 | 0.2 | 0.3 | 0.3 | 0.4 | 0.5 | 0.6 | 0.5 | 0.4 | 0.2 | 0.2 | 0.5 | 0.3 | ||
| 1987 | 0.2 | 0.1 | 0.2 | 0.1 | 0.2 | 0.1 | 0.2 | 0.2 | 0.2 | 0.4 | 0.5 | 0.4 | 0.4 | 0.2 | 0.2 | 0.4 | 0.3 | ||
| 1986 | 0.1 | 0.2 | 0.1 | 0.0 | 0.0 | 0.0 | 0.0 | 0.0 | 0.0 | 0.4 | 0.5 | 0.1 | 0.2 | 0.1 | 0.0 | 0.3 | 0.1 | ||
| 1985 | 0.0 | 0.0 | 0.0 | 0.0 | 0.0 | 0.0 | 0.0 | 0.0 | 0.0 | 0.1 | 0.3 | 0.1 | 0.0 | 0.0 | 0.0 | 0.1 | 0.0 | ||
| 1984 | 0.0 | 0.0 | 0.0 | 0.0 | 0.0 | 0.0 | 0.0 | 0.0 | 0.0 | 0.1 | 0.1 | 0.0 | 0.0 | 0.0 | 0.0 | 0.0 | 0.0 | ||
| 1983 | 0.0 | 0.0 | 0.0 | 0.0 | 0.0 | 0.0 | 0.0 | 0.0 | 0.0 | - | 0.0 | 0.0 | 0.0 | 0.0 | 0.0 | 0.0 | 0.0 | ||
| 1982 | - | 0.0 | - | 0.0 | 0.0 | 0.0 | - | 0.0 | - | 0.0 | - | 0.0 | 0.0 | 0.0 | 0.0 | 0.0 | 0.0 | ||
Reporting rates
Reporting rate is the proportion of all surveys in which the species was present.
Reporting rate by year
This chart shows the reporting rate of White-eared Honeyeater each year between 1982 and 2017. 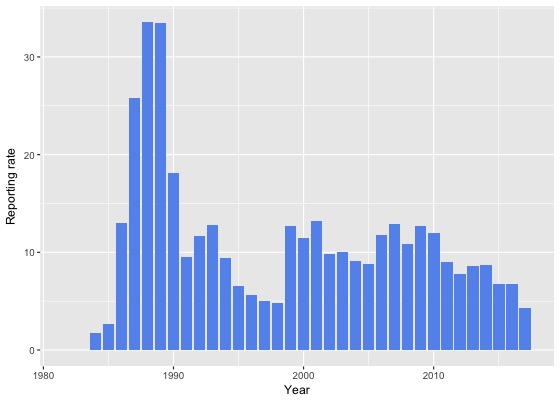
Reporting rate by month
This chart shows the reporting rate by month of White-eared Honeyeater. The blue lines show the reporting rate for the twelve months to June 2017 and the bars show the average reporting rate for the period 1982 to 2017. 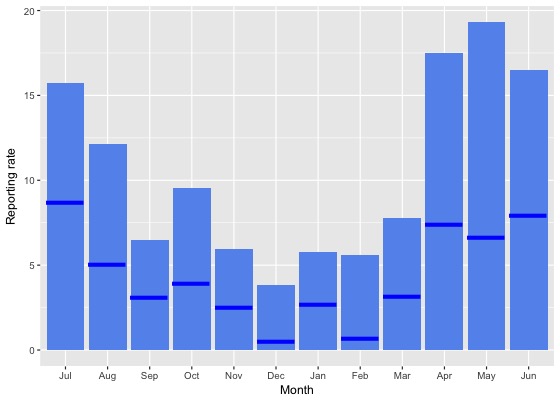
Reporting rate by season
This chart shows the seasonal reporting rate of White-eared Honeyeater. The blue lines show the seasonal reporting rate for the twelve months to June 2017 and the bars show the average seasonal reporting rate for the period 1982 to 2017. 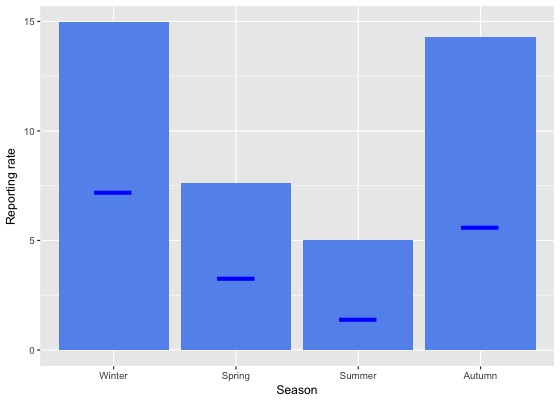
Reporting rate data
| Month | Season | ||||||||||||||||||
|---|---|---|---|---|---|---|---|---|---|---|---|---|---|---|---|---|---|---|---|
| Period | Jul | Aug | Sep | Oct | Nov | Dec | Jan | Feb | Mar | Apr | May | Jun | Winter | Spring | Summer | Autumn | All | ||
| All years | |||||||||||||||||||
| All | 15.7 | 12.2 | 6.5 | 9.6 | 5.9 | 3.8 | 5.7 | 5.6 | 7.8 | 17.5 | 19.3 | 16.5 | 15.0 | 7.6 | 5.0 | 14.3 | 10.1 | ||
| Previous years | |||||||||||||||||||
| All previous years | 16.8 | 13.5 | 7.0 | 10.3 | 6.5 | 4.3 | 6.3 | 6.6 | 8.6 | 19.1 | 22.2 | 18.1 | 16.4 | 8.3 | 5.7 | 15.9 | 11.1 | ||
| Previous 30 years | 16.9 | 13.6 | 7.0 | 10.5 | 6.6 | 4.4 | 6.4 | 6.7 | 8.6 | 19.1 | 22.2 | 18.3 | 16.5 | 8.4 | 5.8 | 15.9 | 11.2 | ||
| Previous 20 years | 13.8 | 10.1 | 4.8 | 10.0 | 4.2 | 2.7 | 4.8 | 5.0 | 6.9 | 16.8 | 18.6 | 16.0 | 13.7 | 6.9 | 4.1 | 13.4 | 9.1 | ||
| 10 year groups | |||||||||||||||||||
| [2007,2017) | 13.1 | 9.0 | 4.2 | 10.6 | 3.4 | 2.6 | 4.6 | 4.8 | 6.4 | 16.3 | 15.6 | 14.4 | 12.4 | 7.1 | 4.0 | 12.3 | 8.6 | ||
| [1997,2007) | 15.0 | 12.4 | 6.0 | 8.1 | 5.8 | 2.9 | 5.6 | 5.4 | 7.9 | 18.3 | 25.9 | 19.5 | 16.2 | 6.6 | 4.4 | 15.7 | 10.4 | ||
| [1987,1997) | 27.9 | 24.4 | 18.4 | 12.9 | 14.3 | 14.1 | 15.3 | 14.9 | 18.6 | 30.8 | 35.7 | 30.3 | 27.4 | 15.0 | 14.8 | 28.2 | 21.1 | ||
| 5 year groups | |||||||||||||||||||
| [2012,2017) | 11.5 | 8.3 | 4.3 | 8.1 | 2.7 | 2.1 | 3.9 | 3.9 | 6.2 | 14.9 | 14.1 | 13.5 | 11.3 | 5.5 | 3.4 | 11.3 | 7.4 | ||
| [2007,2012) | 17.7 | 11.5 | 4.2 | 14.9 | 5.6 | 3.5 | 7.2 | 9.0 | 6.9 | 19.4 | 20.1 | 15.9 | 15.3 | 10.2 | 6.0 | 14.9 | 11.3 | ||
| [2002,2007) | 14.2 | 12.1 | 5.3 | 9.1 | 5.4 | 2.9 | 4.8 | 5.5 | 7.4 | 16.8 | 22.7 | 19.3 | 15.8 | 6.8 | 4.1 | 14.1 | 10.0 | ||
| [1997,2002) | 16.3 | 12.7 | 6.7 | 6.4 | 6.3 | 2.9 | 6.6 | 5.4 | 8.7 | 20.2 | 29.8 | 19.7 | 16.7 | 6.5 | 4.7 | 17.8 | 10.9 | ||
| [1992,1997) | 11.1 | 11.3 | 6.9 | 5.6 | 5.1 | 2.9 | 6.1 | 4.3 | 7.3 | 15.5 | 16.0 | 12.3 | 11.6 | 5.8 | 4.5 | 12.8 | 8.7 | ||
| [1987,1992) | 35.5 | 31.5 | 23.9 | 17.0 | 18.7 | 18.9 | 20.4 | 18.9 | 25.3 | 39.6 | 45.9 | 40.4 | 35.6 | 19.6 | 19.4 | 36.8 | 27.3 | ||
| Year | |||||||||||||||||||
| 2017 | 8.7 | 5.1 | 3.1 | 3.9 | 2.5 | 0.5 | 2.7 | 0.7 | 3.2 | 7.4 | 6.7 | 7.9 | 7.2 | 3.3 | 1.4 | 5.6 | 4.3 | ||
| 2016 | 8.8 | 8.1 | 4.4 | 5.7 | 2.9 | 1.2 | 3.7 | 3.9 | 5.6 | 14.2 | 13.1 | 11.3 | 9.4 | 4.6 | 3.1 | 10.7 | 6.8 | ||
| 2015 | 13.1 | 7.2 | 5.4 | 7.4 | 2.0 | 2.5 | 2.6 | 3.8 | 7.0 | 10.8 | 11.7 | 11.8 | 10.9 | 5.3 | 3.0 | 9.6 | 6.8 | ||
| 2014 | 14.5 | 10.1 | 2.6 | 10.8 | 1.1 | 2.8 | 4.4 | 3.9 | 7.7 | 19.4 | 17.3 | 15.1 | 13.5 | 6.3 | 3.9 | 13.9 | 8.7 | ||
| 2013 | 10.9 | 10.9 | 4.1 | 11.4 | 4.4 | 2.2 | 3.4 | 4.7 | 4.6 | 20.5 | 20.1 | 18.1 | 13.6 | 7.4 | 3.2 | 13.5 | 8.6 | ||
| 2012 | 14.2 | 7.1 | 3.7 | 7.8 | 2.7 | 3.0 | 6.0 | 2.9 | 6.5 | 14.6 | 13.4 | 16.6 | 13.0 | 5.5 | 4.5 | 11.3 | 7.8 | ||
| 2011 | 21.1 | 16.8 | 4.3 | 9.3 | 7.9 | 1.5 | 3.0 | 6.8 | 2.5 | 21.0 | 12.0 | 12.8 | 15.4 | 7.6 | 3.4 | 11.8 | 9.0 | ||
| 2010 | 18.8 | 7.9 | 1.9 | 16.6 | 4.8 | 2.9 | 9.7 | 5.9 | 5.5 | 25.1 | 30.4 | 19.5 | 16.5 | 9.9 | 5.8 | 17.6 | 12.0 | ||
| 2009 | 20.9 | 11.5 | 3.4 | 16.9 | 6.7 | 4.2 | 10.7 | 10.0 | 16.3 | 16.4 | 20.6 | 12.6 | 14.9 | 11.2 | 7.8 | 17.3 | 12.7 | ||
| 2008 | 12.4 | 7.8 | 4.5 | 12.5 | 3.4 | 2.3 | 8.7 | 13.9 | 5.4 | 14.6 | 23.4 | 21.5 | 15.4 | 9.0 | 6.8 | 13.4 | 10.9 | ||
| 2007 | 15.4 | 13.0 | 7.1 | 20.1 | 4.7 | 6.7 | 7.9 | 9.6 | 6.8 | 20.9 | 26.0 | 14.7 | 14.4 | 13.6 | 7.6 | 16.4 | 12.9 | ||
| 2006 | 15.8 | 6.8 | 2.6 | 15.9 | 7.7 | 2.2 | 4.5 | 5.9 | 8.2 | 17.2 | 23.2 | 25.3 | 18.8 | 10.3 | 4.1 | 13.8 | 11.8 | ||
| 2005 | 8.1 | 10.3 | 5.2 | 7.2 | 2.1 | 4.0 | 7.1 | 13.0 | 3.5 | 9.3 | 22.4 | 14.9 | 12.1 | 5.0 | 6.6 | 11.4 | 8.8 | ||
| 2004 | 14.3 | 10.5 | 8.7 | 5.2 | 7.6 | 1.4 | 5.5 | 6.1 | 2.1 | 22.5 | 17.5 | 9.8 | 12.0 | 7.2 | 3.7 | 13.2 | 9.1 | ||
| 2003 | 18.8 | 16.5 | 6.4 | 2.6 | 1.8 | 1.7 | 3.7 | 1.6 | 13.5 | 17.5 | 26.4 | 23.0 | 19.7 | 3.7 | 2.2 | 17.9 | 10.1 | ||
| 2002 | 14.3 | 15.3 | 4.0 | 7.7 | 8.0 | 4.1 | 3.1 | 4.6 | 8.6 | 17.3 | 23.5 | 22.0 | 17.5 | 6.6 | 4.0 | 14.4 | 9.8 | ||
| 2001 | 17.3 | 15.7 | 7.4 | 9.2 | 5.1 | 4.7 | 7.5 | 9.8 | 11.4 | 26.3 | 31.2 | 23.2 | 18.9 | 7.5 | 7.0 | 20.6 | 13.2 | ||
| 2000 | 23.8 | 13.1 | 7.9 | 5.7 | 14.4 | 1.3 | 6.2 | 3.3 | 10.2 | 25.2 | 24.5 | 19.4 | 18.5 | 9.3 | 3.5 | 18.8 | 11.5 | ||
| 1999 | 20.6 | 14.4 | 8.0 | 6.3 | 4.5 | 5.0 | 6.6 | 5.0 | 6.5 | 15.5 | 35.2 | 23.8 | 20.9 | 6.4 | 5.5 | 18.7 | 12.7 | ||
| 1998 | 5.4 | 11.3 | 4.9 | 4.3 | 1.8 | 0.9 | 8.8 | 0.0 | 1.1 | 2.6 | 25.9 | 8.0 | 8.5 | 3.7 | 3.1 | 5.7 | 4.8 | ||
| 1997 | 5.7 | 1.7 | 1.8 | 2.6 | 0.0 | 1.0 | 2.0 | 3.5 | 5.0 | 12.8 | 17.8 | 11.1 | 6.5 | 1.3 | 1.9 | 12.4 | 5.0 | ||
| 1996 | 13.4 | 6.4 | 2.7 | 4.4 | 0.9 | 3.0 | 2.9 | 5.9 | 1.0 | 6.2 | 13.8 | 13.8 | 10.9 | 2.7 | 3.8 | 5.8 | 5.6 | ||
| 1995 | 8.6 | 7.8 | 2.9 | 2.4 | 5.5 | 0.0 | 1.8 | 3.2 | 4.1 | 15.3 | 19.5 | 9.6 | 8.5 | 3.4 | 1.5 | 12.7 | 6.5 | ||
| 1994 | 11.8 | 11.7 | 4.4 | 7.0 | 3.7 | 8.7 | 10.3 | 0.0 | 8.0 | 16.8 | 10.0 | 16.9 | 13.8 | 4.8 | 6.4 | 12.4 | 9.4 | ||
| 1993 | 10.2 | 20.5 | 19.4 | 9.3 | 6.1 | 4.3 | 12.2 | 0.0 | 13.6 | 11.7 | 20.8 | 13.0 | 15.3 | 11.3 | 6.3 | 15.6 | 12.8 | ||
| 1992 | 12.3 | 14.8 | 8.2 | 8.5 | 12.5 | 1.6 | 10.3 | 12.2 | 12.7 | 27.1 | 15.8 | 6.7 | 11.2 | 9.6 | 7.4 | 18.0 | 11.7 | ||
| 1991 | 11.0 | 8.5 | 1.2 | 3.9 | 7.2 | 2.7 | 8.9 | 0.0 | 7.9 | 32.2 | 14.8 | 28.0 | 13.3 | 4.2 | 3.9 | 18.0 | 9.6 | ||
| 1990 | 33.5 | 32.4 | 15.1 | 3.1 | 11.2 | 13.9 | 11.1 | 12.7 | 3.4 | 16.7 | 24.7 | 13.2 | 29.3 | 9.7 | 12.6 | 14.3 | 18.1 | ||
| 1989 | 48.5 | 35.3 | 41.5 | 25.4 | 18.2 | 29.1 | 26.6 | 24.2 | 31.7 | 37.4 | 53.3 | 36.3 | 39.9 | 28.7 | 26.8 | 40.0 | 33.4 | ||
| 1988 | 40.1 | 36.9 | 21.3 | 21.1 | 20.8 | 19.5 | 26.1 | 25.7 | 38.6 | 48.7 | 56.1 | 52.2 | 42.4 | 21.0 | 23.7 | 47.7 | 33.5 | ||
| 1987 | 18.2 | 6.7 | 20.6 | 14.8 | 23.0 | 14.7 | 15.4 | 15.4 | 21.5 | 44.0 | 47.2 | 45.1 | 41.3 | 19.8 | 15.2 | 38.2 | 25.8 | ||
| 1986 | 15.4 | 23.7 | 9.4 | 0.0 | 4.3 | 0.0 | 0.0 | 0.0 | 3.2 | 37.3 | 48.3 | 8.6 | 16.2 | 5.1 | 0.0 | 30.6 | 13.0 | ||
| 1985 | 0.0 | 0.0 | 0.0 | 0.0 | 1.8 | 0.0 | 0.0 | 0.0 | 0.0 | 10.5 | 30.0 | 17.9 | 5.7 | 0.5 | 0.0 | 12.5 | 2.7 | ||
| 1984 | 0.0 | 0.0 | 0.0 | 0.0 | 0.0 | 0.0 | 0.0 | 0.0 | 0.0 | 2.9 | 6.5 | 2.9 | 2.0 | 0.0 | 0.0 | 3.3 | 1.7 | ||
| 1983 | 0.0 | 0.0 | 0.0 | 0.0 | 0.0 | 0.0 | 0.0 | 0.0 | 0.0 | - | 0.0 | 0.0 | 0.0 | 0.0 | 0.0 | 0.0 | 0.0 | ||
| 1982 | - | 0.0 | - | 0.0 | 0.0 | 0.0 | - | 0.0 | - | 0.0 | - | 0.0 | 0.0 | 0.0 | 0.0 | 0.0 | 0.0 | ||
Breeding data
Breeding records by month
Number of breeding records by breeding code and month, 2017 and all years| Breeding code | Jul | Aug | Sep | Oct | Nov | Dec | Jan | Feb | Mar | Apr | May | Jun |
|---|---|---|---|---|---|---|---|---|---|---|---|---|
| 2017 | ||||||||||||
| Breeding (BLA code) | 0 | 0 | 0 | 0 | 0 | 0 | 0 | 0 | 0 | 0 | 0 | 0 |
| Carrying Food | 0 | 0 | 0 | 0 | 0 | 0 | 0 | 0 | 0 | 0 | 0 | 0 |
| Copulating | 0 | 0 | 0 | 0 | 0 | 0 | 0 | 0 | 0 | 0 | 0 | 0 |
| Display | 0 | 0 | 0 | 0 | 0 | 0 | 0 | 0 | 0 | 0 | 0 | 0 |
| Dependent young | 0 | 0 | 0 | 0 | 0 | 0 | 2 | 0 | 0 | 0 | 0 | 0 |
| Faecal sac | 0 | 0 | 0 | 0 | 0 | 0 | 0 | 0 | 0 | 0 | 0 | 0 |
| Inspecting hollow | 0 | 0 | 0 | 0 | 0 | 0 | 0 | 0 | 0 | 0 | 0 | 0 |
| Nest building | 0 | 0 | 0 | 0 | 0 | 0 | 0 | 0 | 0 | 0 | 0 | 0 |
| Nest with eggs | 0 | 0 | 0 | 0 | 0 | 0 | 0 | 0 | 0 | 0 | 0 | 0 |
| Nest with young | 0 | 0 | 0 | 0 | 0 | 0 | 1 | 0 | 0 | 0 | 0 | 0 |
| On/leaving nest | 0 | 0 | 0 | 0 | 0 | 0 | 0 | 0 | 0 | 0 | 0 | 0 |
| All years | ||||||||||||
| Breeding (BLA code) | 1 | 1 | 1 | 0 | 2 | 1 | 0 | 0 | 0 | 0 | 0 | 0 |
| Carrying Food | 0 | 0 | 0 | 3 | 1 | 0 | 6 | 0 | 0 | 0 | 0 | 0 |
| Copulating | 0 | 0 | 0 | 0 | 0 | 0 | 0 | 0 | 0 | 0 | 0 | 0 |
| Display | 0 | 0 | 0 | 0 | 0 | 0 | 0 | 0 | 0 | 0 | 0 | 0 |
| Dependent young | 0 | 0 | 0 | 9 | 3 | 7 | 12 | 13 | 7 | 2 | 0 | 0 |
| Faecal sac | 0 | 0 | 0 | 0 | 0 | 0 | 0 | 0 | 0 | 0 | 0 | 0 |
| Inspecting hollow | 0 | 0 | 0 | 0 | 0 | 0 | 0 | 0 | 0 | 0 | 0 | 0 |
| Nest building | 0 | 0 | 1 | 0 | 1 | 1 | 1 | 0 | 0 | 0 | 0 | 0 |
| Nest with eggs | 0 | 0 | 0 | 2 | 1 | 0 | 4 | 0 | 1 | 0 | 0 | 0 |
| Nest with young | 0 | 0 | 0 | 0 | 3 | 0 | 3 | 1 | 0 | 0 | 0 | 0 |
| On/leaving nest | 0 | 0 | 0 | 1 | 0 | 0 | 0 | 0 | 0 | 0 | 0 | 0 |
Breeding records by year
Average number of breeding records per period by breeding code| Period | Breeding (BLA code) | Carrying Food | Copulating | Display | Dependent young | Faecal sac | Inspecting hollow | Nest building | Nest with eggs | Nest with young | On/leaving nest |
|---|---|---|---|---|---|---|---|---|---|---|---|
| All years | |||||||||||
| All | 0.2 | 0.3 | 0.0 | 0.0 | 1.5 | 0.0 | 0.0 | 0.1 | 0.2 | 0.2 | 0.0 |
| Previous years | |||||||||||
| All previous years | 0.2 | 0.3 | 0.0 | 0.0 | 1.5 | 0.0 | 0.0 | 0.1 | 0.2 | 0.2 | 0.0 |
| Previous 30 years | 0.2 | 0.3 | 0.0 | 0.0 | 1.7 | 0.0 | 0.0 | 0.1 | 0.3 | 0.2 | 0.0 |
| Previous 20 years | 0.3 | 0.2 | 0.0 | 0.0 | 1.3 | 0.0 | 0.0 | 0.1 | 0.0 | 0.2 | 0.0 |
| 10 year groups | |||||||||||
| [2007,2017) | 0.3 | 0.2 | 0.0 | 0.0 | 2.1 | 0.0 | 0.0 | 0.2 | 0.1 | 0.4 | 0.0 |
| [1997,2007) | 0.3 | 0.2 | 0.0 | 0.0 | 0.5 | 0.0 | 0.0 | 0.0 | 0.0 | 0.1 | 0.1 |
| [1987,1997) | 0.0 | 0.6 | 0.0 | 0.0 | 2.5 | 0.0 | 0.0 | 0.2 | 0.7 | 0.1 | 0.0 |
| 5 year groups | |||||||||||
| [2012,2017) | 0.0 | 0.0 | 0.0 | 0.0 | 1.8 | 0.0 | 0.0 | 0.2 | 0.0 | 0.6 | 0.0 |
| [2007,2012) | 0.6 | 0.4 | 0.0 | 0.0 | 2.4 | 0.0 | 0.0 | 0.2 | 0.2 | 0.2 | 0.0 |
| [2002,2007) | 0.0 | 0.4 | 0.0 | 0.0 | 0.8 | 0.0 | 0.0 | 0.0 | 0.0 | 0.0 | 0.2 |
| [1997,2002) | 0.6 | 0.0 | 0.0 | 0.0 | 0.2 | 0.0 | 0.0 | 0.0 | 0.0 | 0.2 | 0.0 |
| [1992,1997) | 0.0 | 0.0 | 0.0 | 0.0 | 0.2 | 0.0 | 0.0 | 0.0 | 0.2 | 0.0 | 0.0 |
| [1987,1992) | 0.0 | 1.2 | 0.0 | 0.0 | 4.8 | 0.0 | 0.0 | 0.4 | 1.2 | 0.2 | 0.0 |
| Year | |||||||||||
| 2017 | 0.0 | 0.0 | 0.0 | 0.0 | 2.0 | 0.0 | 0.0 | 0.0 | 0.0 | 1.0 | 0.0 |
| 2016 | 0.0 | 0.0 | 0.0 | 0.0 | 2.0 | 0.0 | 0.0 | 1.0 | 0.0 | 2.0 | 0.0 |
| 2015 | 0.0 | 0.0 | 0.0 | 0.0 | 2.0 | 0.0 | 0.0 | 0.0 | 0.0 | 1.0 | 0.0 |
| 2014 | 0.0 | 0.0 | 0.0 | 0.0 | 3.0 | 0.0 | 0.0 | 0.0 | 0.0 | 0.0 | 0.0 |
| 2013 | 0.0 | 0.0 | 0.0 | 0.0 | 1.0 | 0.0 | 0.0 | 0.0 | 0.0 | 0.0 | 0.0 |
| 2012 | 0.0 | 0.0 | 0.0 | 0.0 | 1.0 | 0.0 | 0.0 | 0.0 | 0.0 | 0.0 | 0.0 |
| 2011 | 0.0 | 0.0 | 0.0 | 0.0 | 0.0 | 0.0 | 0.0 | 1.0 | 0.0 | 0.0 | 0.0 |
| 2010 | 0.0 | 1.0 | 0.0 | 0.0 | 3.0 | 0.0 | 0.0 | 0.0 | 0.0 | 0.0 | 0.0 |
| 2009 | 1.0 | 0.0 | 0.0 | 0.0 | 1.0 | 0.0 | 0.0 | 0.0 | 1.0 | 0.0 | 0.0 |
| 2008 | 0.0 | 1.0 | 0.0 | 0.0 | 8.0 | 0.0 | 0.0 | 0.0 | 0.0 | 1.0 | 0.0 |
| 2007 | 2.0 | 0.0 | 0.0 | 0.0 | 0.0 | 0.0 | 0.0 | 0.0 | 0.0 | 0.0 | 0.0 |
| 2006 | 0.0 | 1.0 | 0.0 | 0.0 | 1.0 | 0.0 | 0.0 | 0.0 | 0.0 | 0.0 | 1.0 |
| 2005 | 0.0 | 1.0 | 0.0 | 0.0 | 3.0 | 0.0 | 0.0 | 0.0 | 0.0 | 0.0 | 0.0 |
| 2004 | 0.0 | 0.0 | 0.0 | 0.0 | 0.0 | 0.0 | 0.0 | 0.0 | 0.0 | 0.0 | 0.0 |
| 2003 | 0.0 | 0.0 | 0.0 | 0.0 | 0.0 | 0.0 | 0.0 | 0.0 | 0.0 | 0.0 | 0.0 |
| 2002 | 0.0 | 0.0 | 0.0 | 0.0 | 0.0 | 0.0 | 0.0 | 0.0 | 0.0 | 0.0 | 0.0 |
| 2001 | 0.0 | 0.0 | 0.0 | 0.0 | 0.0 | 0.0 | 0.0 | 0.0 | 0.0 | 1.0 | 0.0 |
| 2000 | 1.0 | 0.0 | 0.0 | 0.0 | 0.0 | 0.0 | 0.0 | 0.0 | 0.0 | 0.0 | 0.0 |
| 1999 | 2.0 | 0.0 | 0.0 | 0.0 | 0.0 | 0.0 | 0.0 | 0.0 | 0.0 | 0.0 | 0.0 |
| 1998 | 0.0 | 0.0 | 0.0 | 0.0 | 1.0 | 0.0 | 0.0 | 0.0 | 0.0 | 0.0 | 0.0 |
| 1997 | 0.0 | 0.0 | 0.0 | 0.0 | 0.0 | 0.0 | 0.0 | 0.0 | 0.0 | 0.0 | 0.0 |
| 1996 | 0.0 | 0.0 | 0.0 | 0.0 | 0.0 | 0.0 | 0.0 | 0.0 | 0.0 | 0.0 | 0.0 |
| 1995 | 0.0 | 0.0 | 0.0 | 0.0 | 0.0 | 0.0 | 0.0 | 0.0 | 0.0 | 0.0 | 0.0 |
| 1994 | 0.0 | 0.0 | 0.0 | 0.0 | 0.0 | 0.0 | 0.0 | 0.0 | 0.0 | 0.0 | 0.0 |
| 1993 | 0.0 | 0.0 | 0.0 | 0.0 | 0.0 | 0.0 | 0.0 | 0.0 | 0.0 | 0.0 | 0.0 |
| 1992 | 0.0 | 0.0 | 0.0 | 0.0 | 1.0 | 0.0 | 0.0 | 0.0 | 1.0 | 0.0 | 0.0 |
| 1991 | 0.0 | 0.0 | 0.0 | 0.0 | 0.0 | 0.0 | 0.0 | 0.0 | 0.0 | 0.0 | 0.0 |
| 1990 | 0.0 | 0.0 | 0.0 | 0.0 | 1.0 | 0.0 | 0.0 | 0.0 | 0.0 | 0.0 | 0.0 |
| 1989 | 0.0 | 1.0 | 0.0 | 0.0 | 12.0 | 0.0 | 0.0 | 0.0 | 2.0 | 1.0 | 0.0 |
| 1988 | 0.0 | 5.0 | 0.0 | 0.0 | 5.0 | 0.0 | 0.0 | 2.0 | 4.0 | 0.0 | 0.0 |
| 1987 | 0.0 | 0.0 | 0.0 | 0.0 | 6.0 | 0.0 | 0.0 | 0.0 | 0.0 | 0.0 | 0.0 |
| 1986 | 0.0 | 0.0 | 0.0 | 0.0 | 0.0 | 0.0 | 0.0 | 0.0 | 0.0 | 0.0 | 0.0 |
| 1985 | 0.0 | 0.0 | 0.0 | 0.0 | 0.0 | 0.0 | 0.0 | 0.0 | 0.0 | 0.0 | 0.0 |
| 1984 | 0.0 | 0.0 | 0.0 | 0.0 | 0.0 | 0.0 | 0.0 | 0.0 | 0.0 | 0.0 | 0.0 |
| 1983 | 0.0 | 0.0 | 0.0 | 0.0 | 0.0 | 0.0 | 0.0 | 0.0 | 0.0 | 0.0 | 0.0 |
| 1982 | 0.0 | 0.0 | 0.0 | 0.0 | 0.0 | 0.0 | 0.0 | 0.0 | 0.0 | 0.0 | 0.0 |
Distribution map
Distribution - 2017
This map shows the observed distribution of the White-eared Honeyeater for 2017.
The red circles are the grid cells where White-eared Honeyeater have been reported.
The transparency of the red circles indicate how many surveys sheets were submitted for that grid cell; the darker the red the more reliable the data. Of the 315 grid cells with reports, 83 had only one sheet; an example is grid number D22.
The size of the circle represents the reporting rate. The maximum reporting rate for White-eared Honeyeater was 100.0% (eg grid number C15) and the minimum was 0.2% (eg grid number J14). 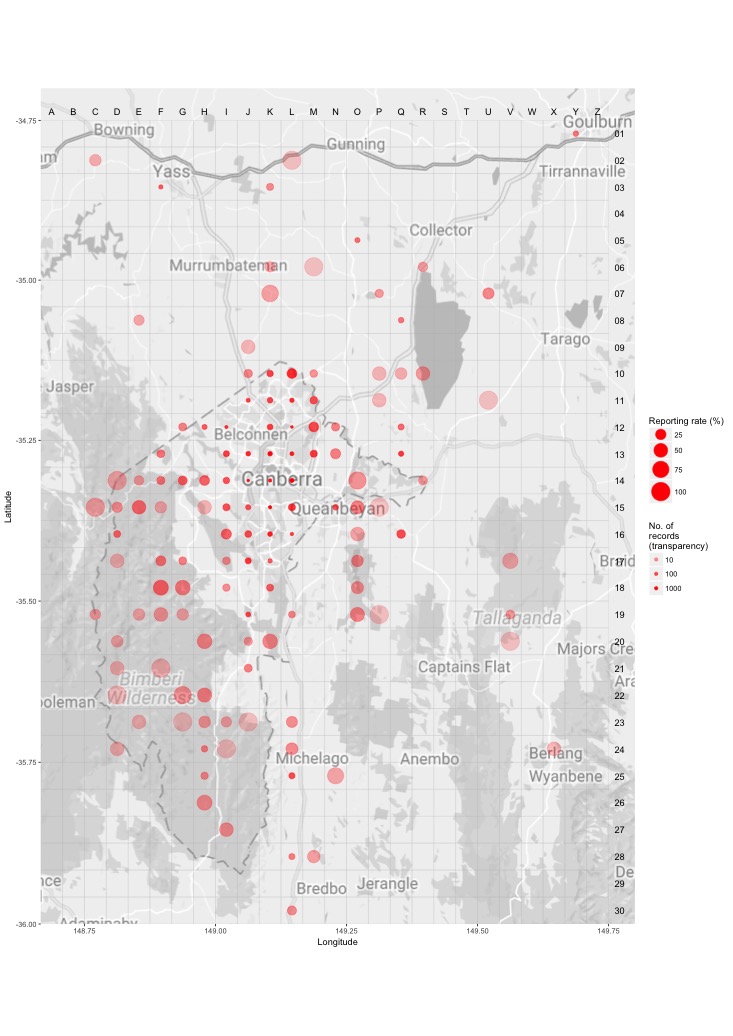
Distribution - all years
This map shows the observed distribution of the White-eared Honeyeater for all years.
The red circles are the grid cells where White-eared Honeyeater have been reported.
The transparency of the red circles indicate how many surveys sheets were submitted for that grid cell; the darker the red the more reliable the data. Of the 703 grid cells with reports, 55 had only one sheet; an example is grid number E29.
The size of the circle represents the reporting rate. The maximum reporting rate for White-eared Honeyeater was 100.0% (eg grid number B22) and the minimum was 0.2% (eg grid number S13). 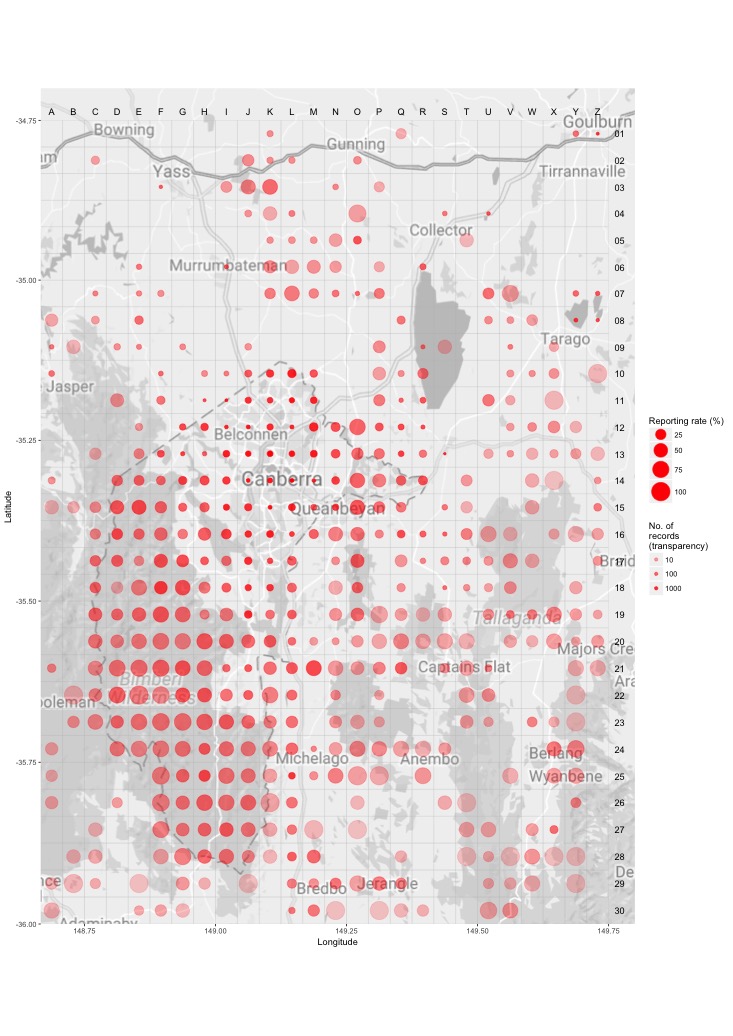
Breeding map
Breeding - 2017
This map shows the breeding distribution of the White-eared Honeyeater for 2017.
The red circles are the grid cells where breeding activity for White-eared Honeyeater have been reported.
The size of the circle represents the number of reports. 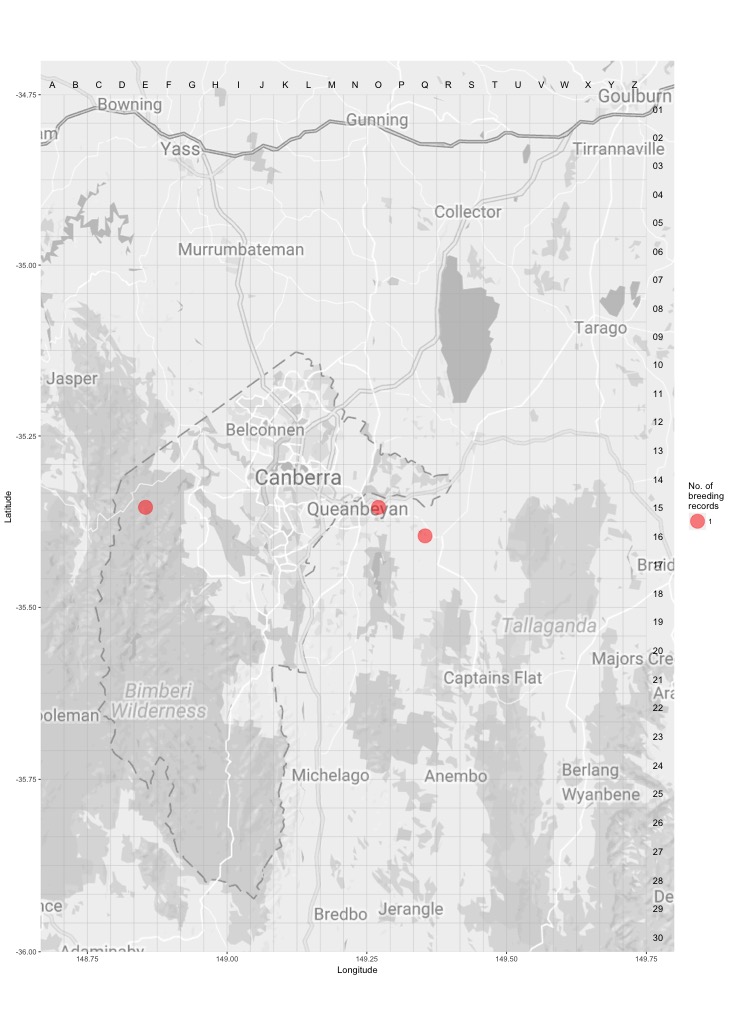
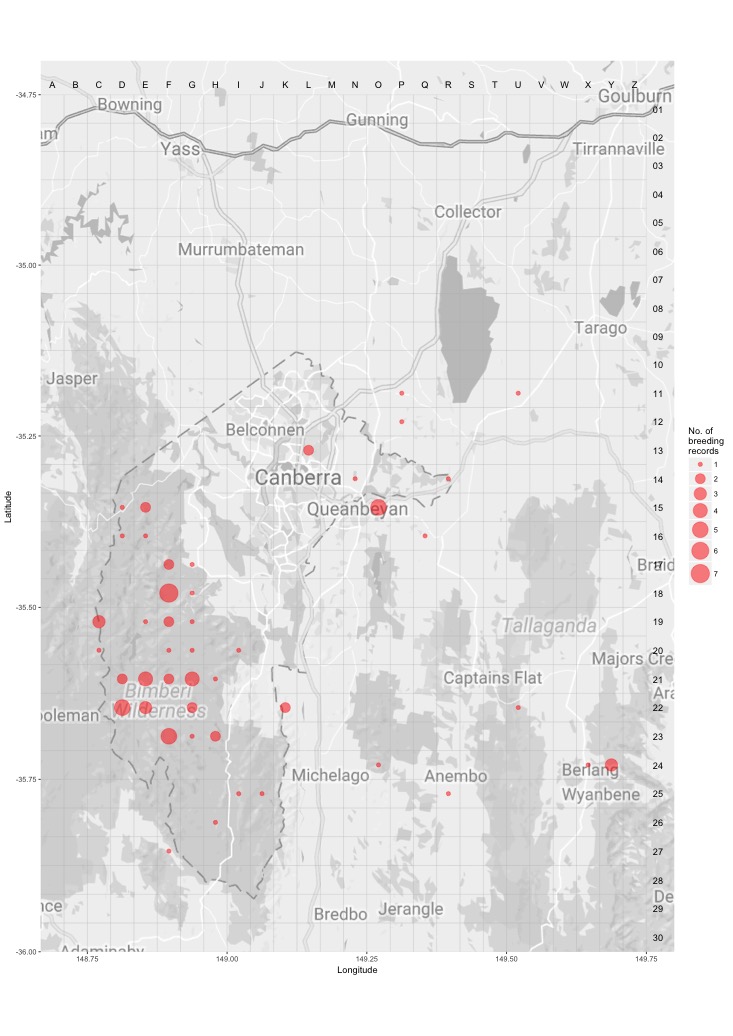
Breeding - all years
This map shows the breeding distribution of the White-eared Honeyeater for all years.
The red circles are the grid cells where breeding activity for White-eared Honeyeater have been reported.
The size of the circle represents the number of reports.